Sales leaders and account teams monitoring revenue, pipeline movement and operational activity.
Product case study · Real-time CRM dashboard · Interactive concept
SalesIQ
A data-dense sales dashboard concept that balances executive overview, pipeline health and individual activity without flattening everything into one chart.
RoleDashboard UX · Data hierarchy · Visual design · Prototype
ScopeKPI overview, charting, pipeline, team performance, activity
DeliveredA responsive dashboard interface with clear information tiers
BuildResponsive analytics prototype with realistic sample pipeline data
01 / Situation
The situation
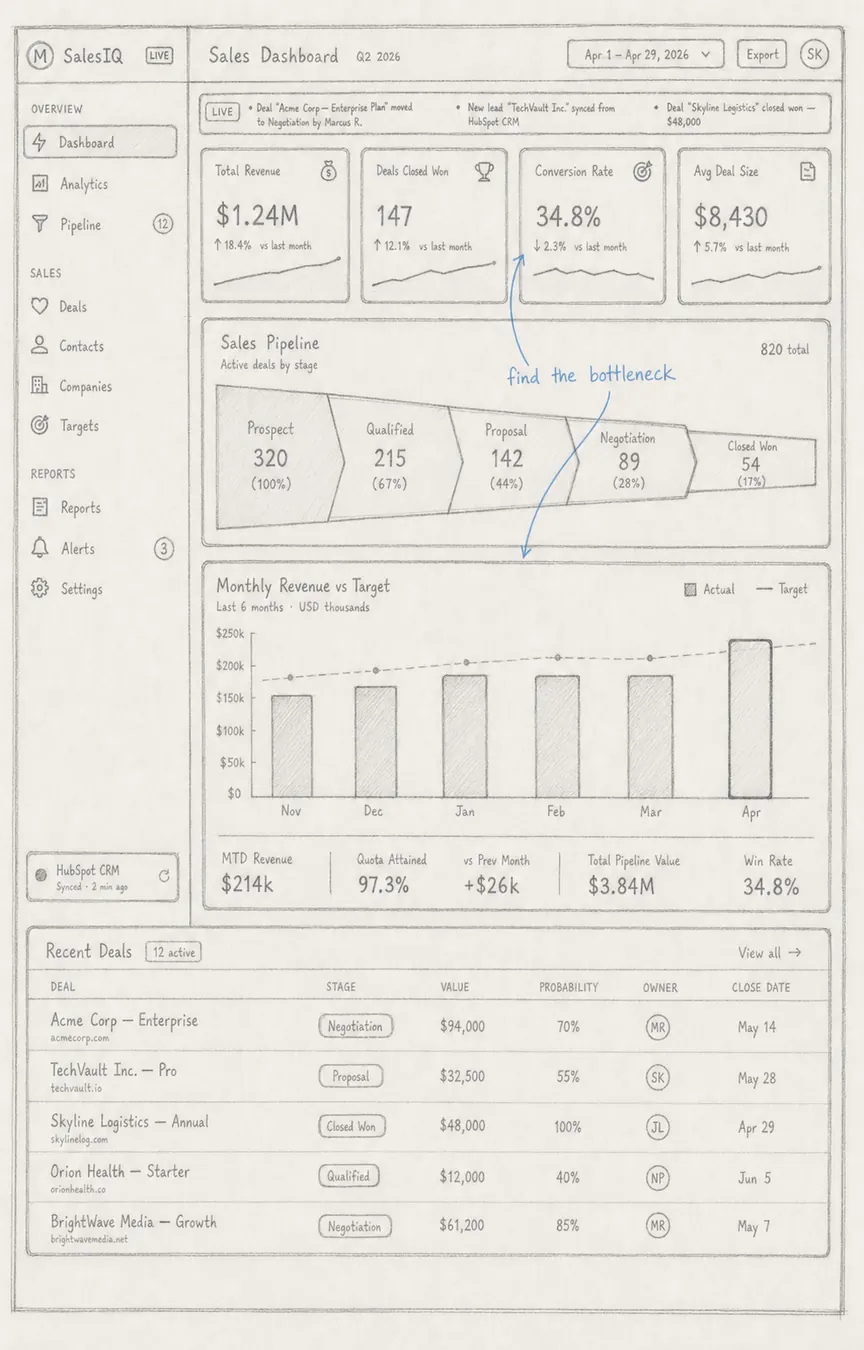
Sales teams need fast answers at different levels: whether the business is on track, where deals are getting stuck, and which actions require attention today. Showing every metric with equal weight would make the dashboard slower, not more informative.
Overview → Diagnose → Act
02 / Design logic
Design decisions
Separate health from detail
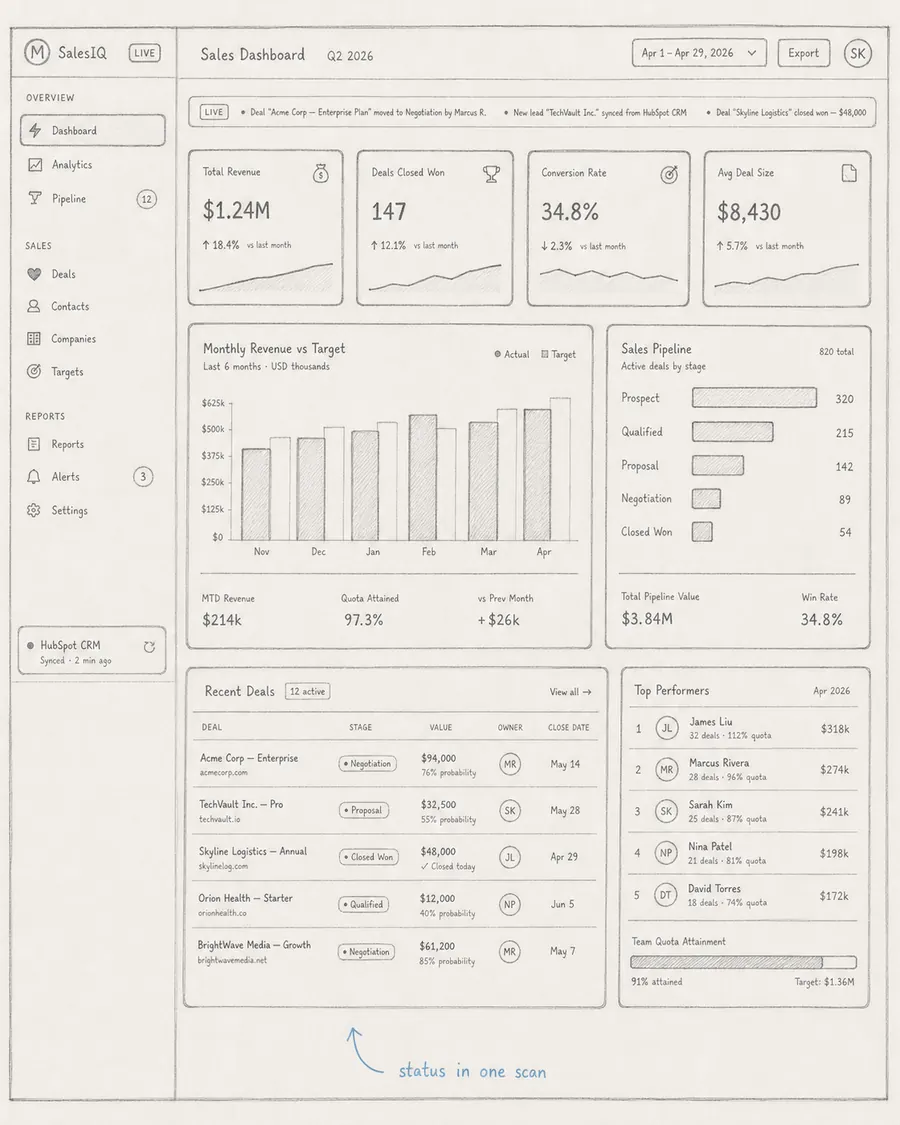
Primary KPIs answer the status question first; pipeline and activity modules then explain why. The layout supports scanning before investigation.
Use comparison, not decoration
Trend indicators, targets and time-series context make numbers interpretable. Colour reinforces state but is not the only signal.
Preserve density without visual noise
A restrained dark system, repeated card structure and aligned numeric columns let many signals coexist without turning the screen into a collage.
03 / Structure
Interface blueprint
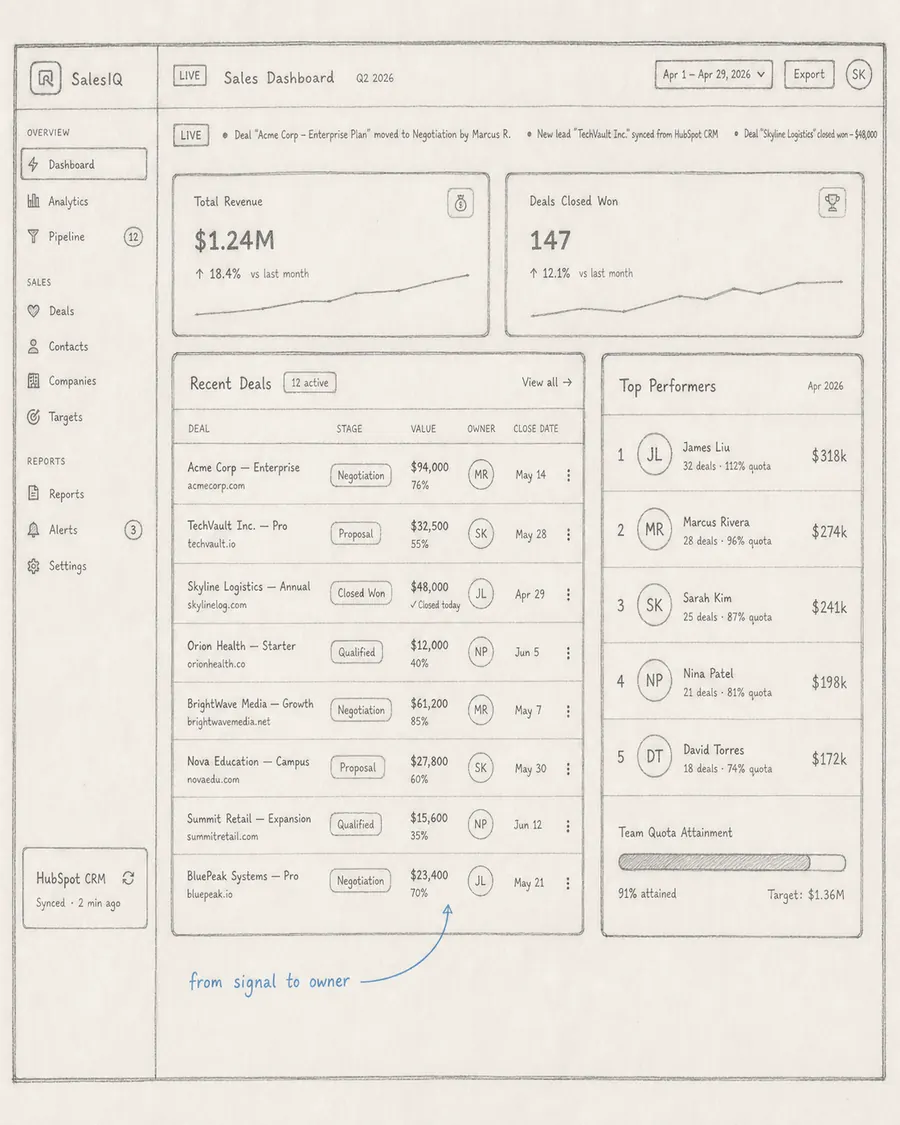
These diagrams map the real blocks, order and proportions used in the finished interface, making the layout decisions easier to inspect.
Overview01
Diagnose02
Act03
04 / Final interface
Final interface
05 / Business impact
What the work changes
A responsive dashboard interface with clear information tiers
The dashboard brings headline performance, pipeline shape, segment comparison and priority accounts into one scan. Filters and period controls stay close to the charts they change, so the page works as a decision surface rather than a report gallery.
Measure the time from finding a weak segment to opening the relevant account.
Track whether priority opportunities receive follow-up inside the review cycle.
Compare which cuts of the data lead to notes, tasks or owner changes.